Product | 02/26/2019
Introducing Rainbow: Donjon’s side-channel analysis simulation tool

The second one is to provide some tools to trace whiteboxed binaries in order to break them, much like Side-Channel Marvels except Rainbow can easily be fed parts of embedded binaries.
State of embedded affairs
Embedded devices are flourishing with vulnerabilities everywhere and this will continue to only get worse as the number of uses for those grow.
Besides the now common software vulnerabilities one should take care of when developing for embedded devices, there are also physical attacks which come into play. Side-channel attacks attempt to retrieve secret keys using power or electromagnetic emanations.
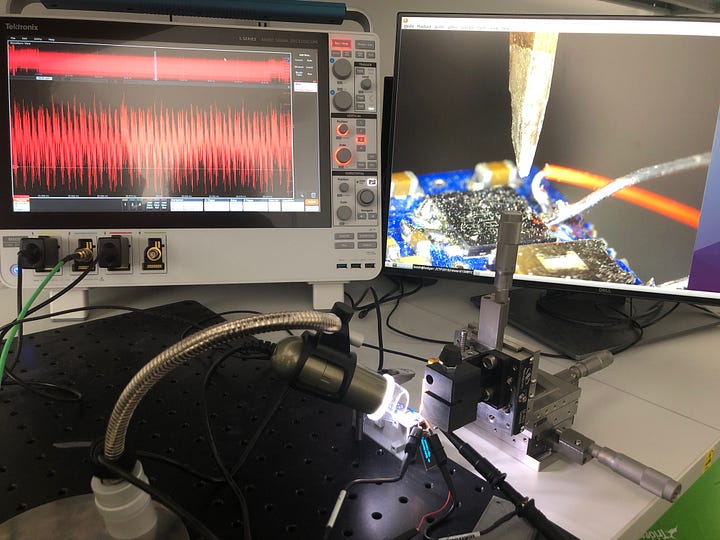
Fault injections use laser or electromagnetic pulses, as well as clock and voltage glitching to change the behaviour of the code running on the device at specific points. A PIN code comparison is blocking an attacker from accessing your data? An attacker can submit a random PIN code and skip the comparison entirely.
The state of affairs of embedded development is not ideal. There are no tools widely available to test against those attacks at the development stage (contrary to when the product is finished) and that do not involve having to purchase or rent expensive equipment (oscilloscopes, probes, laser, …) and requiring expertise.
The REASSURE project did provide an emulator for Cortex-M0 specifically, but we would like to take things a bit further in terms of tooling and provide something more generic.
There was also a suggestion and some draft scripts to achieve side-channel tracing and fault injection with the Unicorn engine (the same tool Rainbow is based on), back in 2015, but this was left as a drafted piece of code in an appendix.
This is why we built Rainbow: we needed a tool to easily and quickly verify the effectiveness of some countermeasures that would otherwise require hard-to-setup real-world attacks.
How this tool works
This tool is built on the Unicorn Engine which allows emulating code snippets for several CPU targets: x86, x86_64, ARM, M68k, … Using the right set of code instrumentation primitives or ‘hooks’, we can extract intermediate data from registers or memory accesses dynamically during execution.

This enables simulation of a side-channel leakage: the user provides an input to the emulated function, and the tool leaks the intermediate values during the execution.
There are other solutions to trace the execution of a program, but in the case of embedded or firmware code, there are some difficulties when using those tools. Using Unicorn allows the use to rip specific parts of the code out of the firmware to test them. Another option could be to simply recompile the code to be tested as a program by itself and use other tools available (Intel Pin, Valgrind) to trace them, but this has drawbacks:
- The produced binary may end up different from what is in the firmware, and may not contain the same flaws
- For each platform you need to test on, there needs to be one version of the aforementioned tools, and possibly different scripts
- You simply might not have access to the source code!
As for fault injection, one can force the execution to skip an instruction in many ways, or use Unicorn’s hooks to execute a very specific value into a register, and check how the code behaves.
Make it easy to use
The tool was made as architecture-agnostic as possible, meaning the tracing behaves the same whether it emulates an x86 CPU or an ARM Cortex one. Capstone is used to detect what registers are affected by an instruction, so that we can precisely select what to leak for each instruction, independently of the CPU.
Another important step was to provide basic functions to load common binaries encountered in embedded development: raw binary files, ELF and Intel Hex formats are all easily loaded into the emulator in a single command.
Implementation
Here are some of the basic features of Rainbow and how they were implemented.
Hooking memory accesses
Unicorn already provides this kind of hook: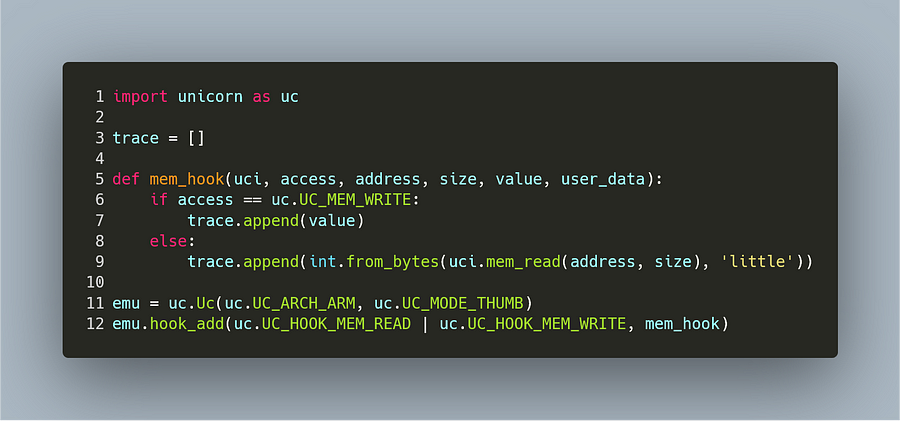
The function mem_hook will be called on every instruction that performs a memory read or write. Inside this function, we append either the value that is going to be written, or the value that is read (which we have to read manually from the address provided by Unicorn).
Hooking register values
We chose to implement something that traces any register move. This time we need a CODE hook which will be called on every instruction just before executing. To determine which registers will be affected, we use Capstone version 4’s regs_access() API. We disassemble the current instruction and retrieve the registers that it implicitly and explicitly writes to. For example, ldr r0, [sp, #8] will modify r0 only.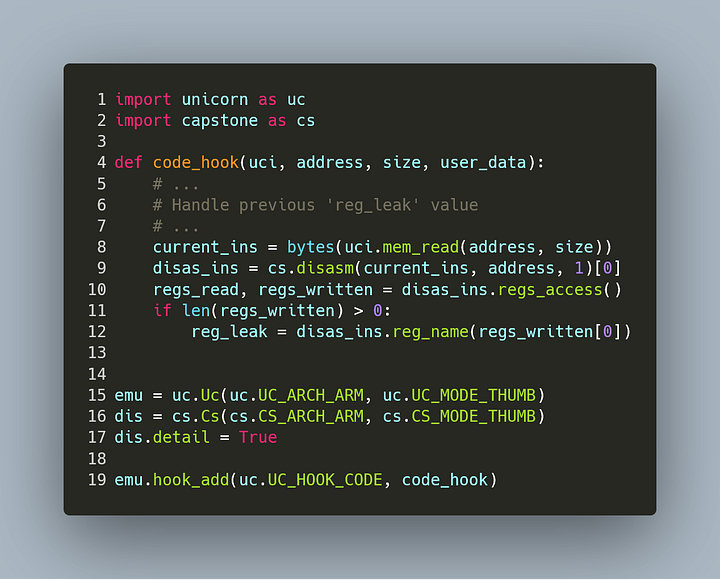
As this hook is called before executing, we defer the reading of the leaked register to the next time the hook is called (which is the following instruction).
Make it extensible
The tool was designed originally for our own use, which includes testing on Secure Elements. That means we need to develop a tracer based on a generic ARM tracer for example, and add in peripheral simulation easily as well as special register naming in the case of debug traces.
Again, Unicorn’s hooks allow this rather seamlessly. Our tool was built with this in mind, so that it only needs very little work to produce a tracer for a whole new device with its own memory mapping, peripherals, and so on.
A simple example is adding a hook on a True Random Number Generator.
Example: Simulating a TRNG
We can do this one of two ways. Either we know that the code will get its random values from some self-contained function and we can hook this, or we know the TRNG register’s address and can write to it just before it is read.
Hooking or redefining a function is directly handled in Rainbow. Function names and addresses are loaded together with the binary in the case of ELF files and there is an internal dictionary mapping function names to Python functions that can be passed to the Rainbow instance. Some code block hook (called everytime the code jumps) will perform a check when entering a function whether its name also points to a user function or not.
If it does, the execution is redirected to the user function and can return to the original function — acting as a prolog — or return to the caller.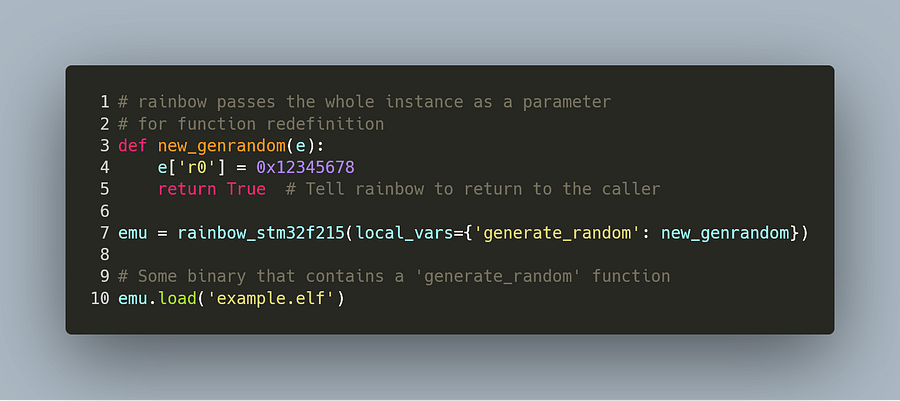
In case the binary file does not have any symbol information, we can do this manually if we know its address:
Below is the second way to do this, which is to hook all register reads from the TRNG’s address: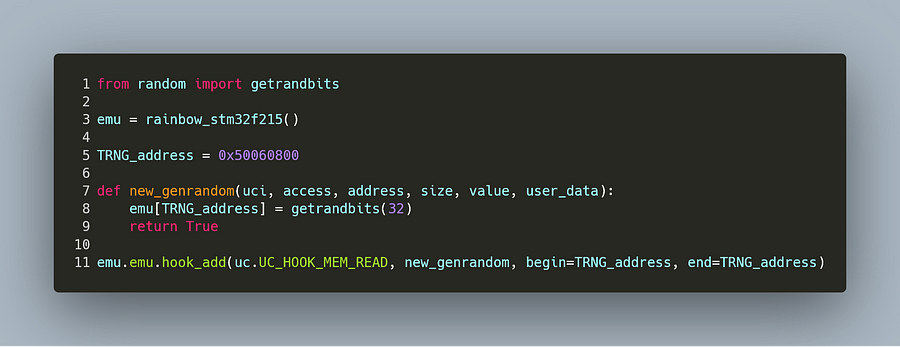
It is simply a memory read hook that is active only on this particular address. It is called just before Unicorn actually executes the instruction, so the hook function writes directly in the register and it will be read by the emulated code when the hook is exited.
What does it look like ?
First, we need to grab a trace after the code was executed: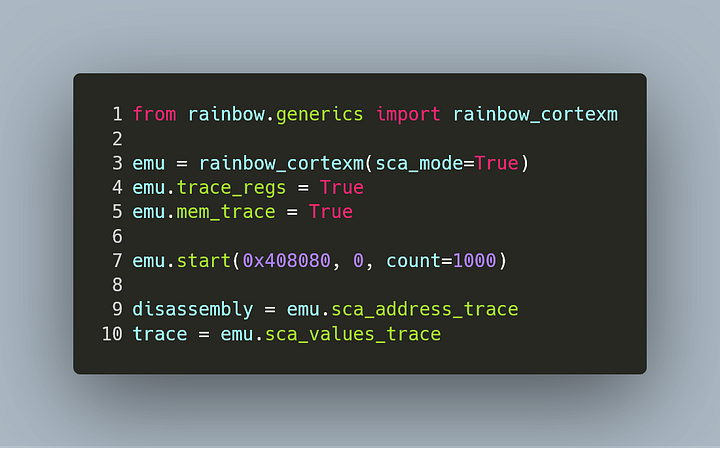
There is a viewer based on VisPy embedded with our code, accessible under rainbow.utils.plot.
The first one takes several traces and simply displays them with a different color, much like matplotlib would do except VisPy makes things a lot quicker :
from rainbow.utils.plot.plot import plot
# (there might be room for naming improvement here...)plot(trace)The other viewer synchronizes a view between the instruction trace and the values:
from rainbow.utils.plot import viewerviewer(disassembly, trace)Using this we can pinpoint exactly what instruction leaks and how much. Once we gather several traces of the same function with different inputs, we can use Lascar to attack it and try to retrieve the key.
Example: An AES optimized for Cortex-M
Let’s attack the AES’s sbox output in the first round on this implementation.
Using the example available on our github repo, we get these execution traces after adding some noise to make it look real:

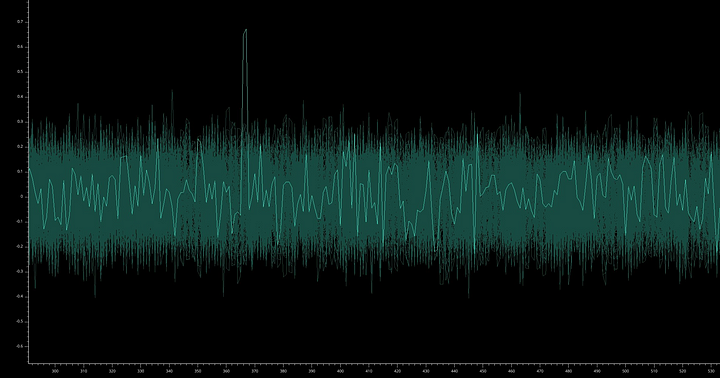
And now the results of a CPA on the first sbox yields:
plot(results, highlight=0x00) # highlights one specific curve among others
There is a clear spike associated to the expected key byte: it’s easily breakable! This is not unexpected as the AES we used for this demo is not protected against side-channels (although you can find one in the same github repo).
Next steps
We provided several examples on our GitHub to showcase what our tool can do in various situations. You will find:
- A simple debug trace example, which showcases some of the added information in a rainbow trace
- An embedded example: how to trace an AES specially optimized for Cortex M platforms and break it using Lascar
- A whitebox example: a script that breaks our own Ledger CTF2 Challenge from last year
There is no fault injection example available yet, though we do have some of them ready. Making a nice interface for fault injection is one of the next tasks before publishing them.
There are also more convincing examples of embedded side-channel tests that we will publish as soon as we’re allowed to!
By Ledger-Donjon — Victor Servant
Code images generated with https://carbon.now.sh


