How to Identify Bull and Bear Market Traps in Crypto

| KEY TAKEAWAYS: |
| — Bull and bear traps are deceptive false price breakouts caused by extreme leverage, thin weekend liquidity, and crypto’s continuous 24/7 trading. — Extreme volatility triggers significant daily liquidations, where overcrowded positioning can lead to devastating single-day liquidation cascades. — Ledger signers protect your crypto holdings through offline key storage while limiting exchange exposure to only your active trading capital. |
Crypto markets stay open all day, everyday and that makes trading them both rich in opportunity, and cut-throat in competition.
By extension, this means crypto exchanges process transactions around the clock, creating unique conditions where false price signals, known as bull and bear traps, flourish with alarming frequency.
Understanding these deceptive patterns has become essential for survival in a market where daily liquidations routinely exceed millions of dollars.
This article is your comprehensive framework for identifying and avoiding these market traps that consistently catch unsuspecting traders off guard.
The Schematics Behind The Crypto Market
Before you can spot bull and bear traps, it helps to understand what makes crypto’s playing field different from stocks or foreign exchange markets.
Crypto Market: Scale & Structure
Crypto is fundamentally different from traditional finance in scale and structure. In the first half of 2025, crypto exchanges processed about $9.36 trillion in trading volume, surpassing the $6.6 trillion traded by all U.S. retail equity investors combined during the same period. This represents crypto’s highest first-half total since 2021.
A growing share of this now comes from perpetual futures – contracts that let traders bet on price using leverage (borrowed money).
Unlike simple spot trading, these contracts don’t expire.
Because so much trading happens through these leveraged bets, even relatively small moves can trigger forced liquidations (the exchange automatically closing over‑leveraged positions) and sharp reversals.
Those are exactly the conditions where bull and bear traps tend to form.
Crypto’s 24/7 Market Cycle
For crypto markets, there’s no daily closing bell where positions get reset and emotions cool off. That means bad positioning can build up for days, and when it finally unwinds, it tends to do so violently, creating the perfect conditions for traps.
Crypto Trading Conditions
Crypto trading conditions aren’t constant. On weekends, trading volume typically drops compared with weekdays, order books get thinner, and it takes less capital to shove price past well‑watched price levels.
Now, let’s dive deeper into what bull and bear traps really are.
What is a Bull Trap in Crypto?
A bull trap is a deceptive price pattern that tricks traders into believing an uptrend is beginning or continuing when the underlying momentum is actually bearish.
When the price of a cryptocurrency suddenly rises above a key price level (called “resistance“; a price where selling has historically stopped further gains), it attracts excited buyers thinking “the breakout is real,” but when the price quickly falls back below that level, those late buyers are left with losses.
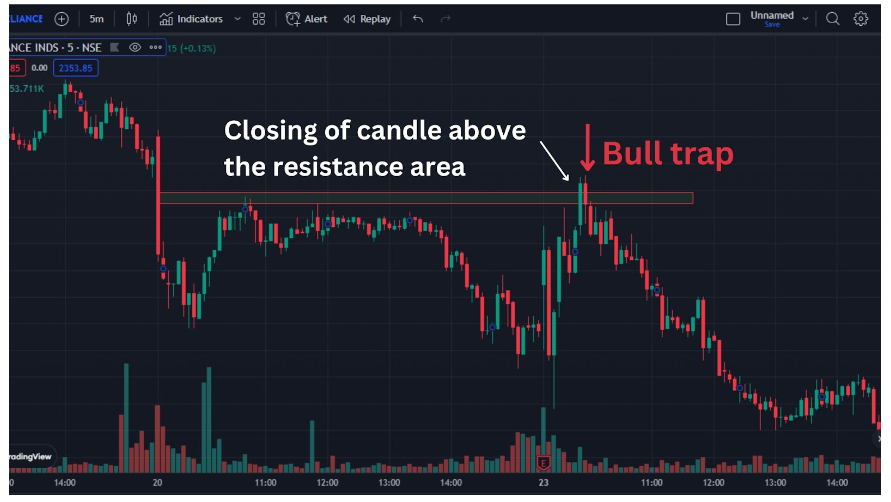
Image source: AngelOne
The trap typically forms when prices break a well-watched resistance level on weak or average volume, show little follow-through, and then quickly close back inside the previous range.
Bull traps typically happen when the price uptick happens on low trading volume (not many people buying), the price quickly falls back below that key level, or when whales or traders with leverage positions are artificially pushing the price up just to profit from the rush of buyers. While bull traps can occur in any market condition, they appear most frequently during downtrends or bear markets, where brief upward movements create false hope of recovery.
What is a Bear Trap in Crypto?
A bear trap is a deceptive price pattern that tricks traders into believing a downtrend is beginning or continuing when the underlying momentum is actually bullish.
This occurs when the price of a cryptocurrency temporarily drops below a significant support level (the price point where buying demand creates a “floor” that prevents further price declines), prompting bearish traders to open short positions or panic-sell their holdings, only to see the price reverse sharply upward.
Bear traps happen when too many traders bet on the price falling (taking ‘short’ positions). When this happens, bearish traders pay fees that go directly to bullish traders—this is called a negative funding rate.
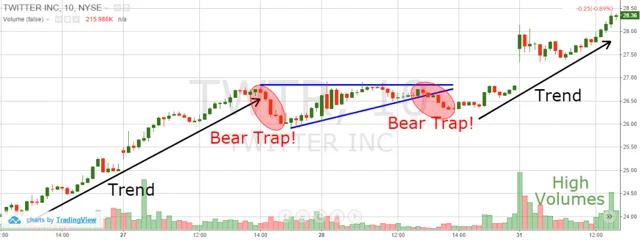
Image source: TradingSim
When the price suddenly reverses and starts rising instead, these short positions automatically close at a loss, forcing a massive sell-off that pushes the price even higher, ultimately trapping anyone who bet on a decline.
Bear traps occur more frequently in bull markets or uptrends, where temporary downward movements create false signals that the rally is ending, tricking traders into selling or shorting before the uptrend resumes
How To Identify Bull & Bear Traps
Identifying bull and bear traps requires sophisticated technical analysis combining multiple indicators. These confirmation tools help traders distinguish genuine breakouts from false signals that lead to costly mistakes.
1. Volume Analysis Methods
Volume is the bedrock of trap detection, serving as the most critical confirmation tool for breakouts.
Raw Volume
Volume reveals conviction. When Bitcoin breaks $94,000 on massive volume, thousands of traders are piling in, which indicates real momentum.
But when that same breakout happens on thin volume, it’s likely a false signal. Smart money waits for eager buyers to show up thinking the breakout is legitimate, then sells into that demand. Once the selling starts, there aren’t enough buyers to sustain the price—and the trap snaps shut.
On-Balance Volume
On-Balance Volume (OBV) tracks whether money is actually flowing into or out of an asset. It’s like a running score: volume gets added on green days and subtracted on red days. If BTC price (or any other asset price) breaks above a certain price but OBV is flat or dropping, it’s most likely a bull trap.
Volume Divergence
Volume divergence is simpler than it sounds: price goes one way, volume goes the other. Price rising on falling volume means the move is running out of buyers. Price falling on falling volume means sellers are exhausted, often right before a bear trap reversal.
2. Price and Momentum Divergence
Price and momentum are meant to move together.
When price goes one way but momentum indicators go the other, that “divergence” is an early warning that the move might be running out of fuel.
Most trading apps give you RSI (Relative Strength Index) and MACD (Moving Average Convergence Divergence) by default.
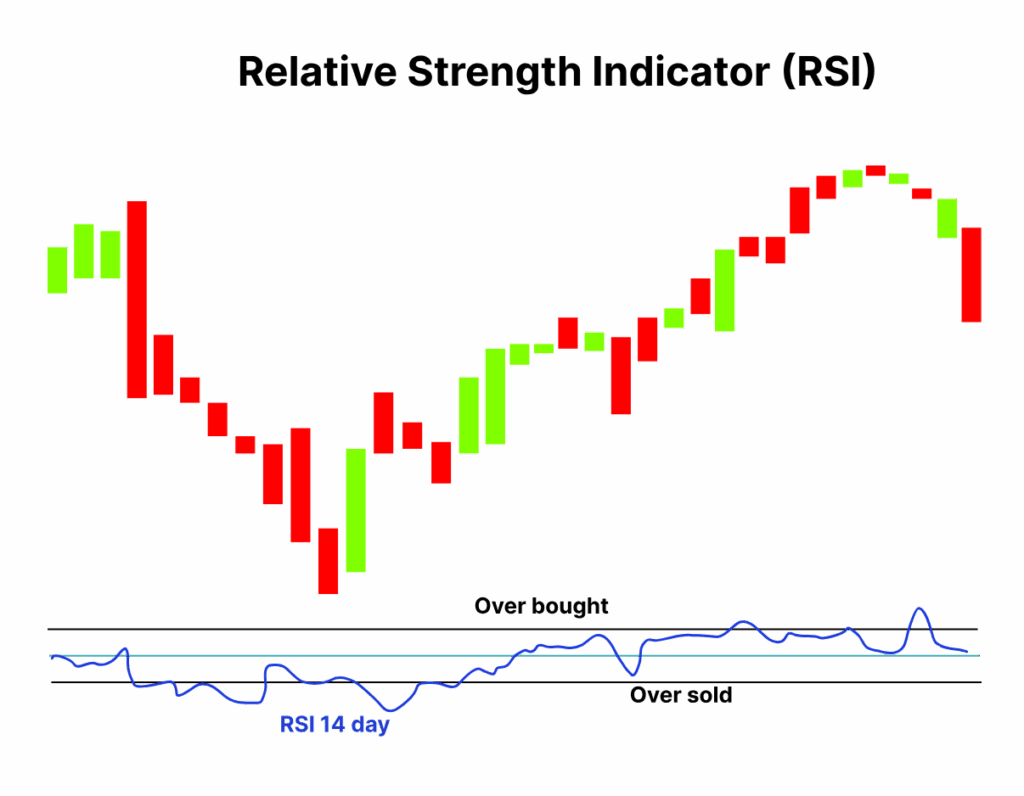
Source: 5Paisa
RSI is a 0–100 line showing when price is stretched (overbought/oversold).
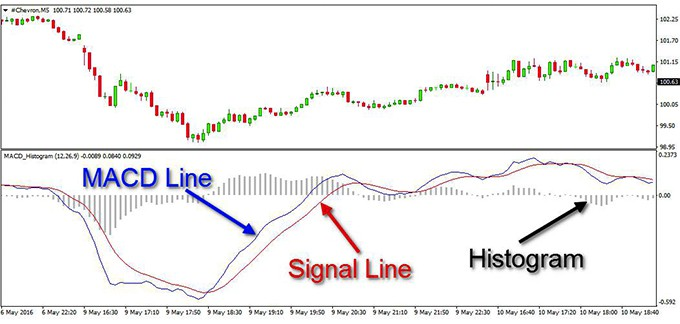
Source spreedtrader
MACD uses two crossing lines to show how strong the current trend really is.
The key patterns are simple:
- Bearish divergence (bull trap risk): Price action creates higher highs on the chart, suggesting strength; but at the same time, RSI or MACD is making lower highs. In other words, while the price appears to be rallying, the underlying momentum is actually weakening.
- Bullish divergence (bear trap risk): Price action creates lower lows, suggesting continued weakness—but RSI or MACD is making higher lows. So, even though the price keeps dropping, selling pressure is quietly fading.
- Dual divergence: When both RSI and MACD show the same divergence pattern simultaneously, that convergence carries significantly more weight than either indicator alone.
Because divergence can last for days or weeks, it is best practice to use it as a cautionary signal. That is to say, it’s worth waiting for the price action to actually confirm a reversal before initiating a trade.
3. Support and Resistance Analysis
Support and resistance levels represent psychological price barriers where buying or selling pressure historically concentrates. They’re levels where the market has historically struggled to go lower (support) or higher (resistance).
They’re the floors and ceilings that traders watch. When price breaks through either one of these levels, the old resistance often becomes new support (and vice versa). If it breaks through but quickly falls back, that’s a trap.
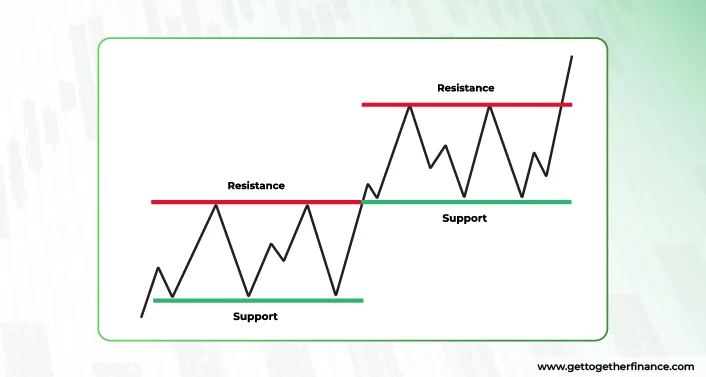
The more times price touches a level without breaking it, the stronger that level becomes. When a level finally breaks with strong volume, the move is more likely genuine; weak volume breaks are more likely traps, especially when they conflict with the volume signals discussed earlier.
4. Funding, Open Interest, & Liquidation
These three metrics show what other traders are doing with leverage, and when they’re about to get forced out of their positions.
Funding Rates
Funding rates are fees paid between traders betting long (price will rise) and short (price will fall). When funding is highly positive (meaning too many people are long), the traders holding long positions par the traders holding short positions . When funding is deeply negative, it means the inverse is true, and so shorts pay longs.
Open Interest
Open Interest (OI) is the total number of active derivative contracts. Rising OI near key price levels means more leverage is piling in; fuel for a trap.
Liquidation
Liquidations happen when price moves against leveraged traders and exchanges automatically close their positions. These forced orders accelerate price moves and often mark exact tops or bottoms.
How They Signal Traps
When too many traders pile on to one price level, you’ll either see long contracts accumulate near resistance or shorts accumulate near support levels, when that key level fails to hold, liquidations start to happen. Each liquidation creates a market order that pushes price further in that direction, which triggers the next layer of liquidations, creating a snowball effect.
If resistance levels don’t break, liquidations kick in and the price starts to dip, nullifying bullish (long) contracts. If support fails to hold, bear contracts get trapped, the price reverses upwards, short positions get liquidated through forced buying, accelerating the bounce and trapping the bears.
5. Order Book Dynamics
Order book structure reveals trap setups invisible to price charts alone.
Thin Liquidity
Thin liquidity during off-hours and weekends makes false moves easier to engineer. Usually, weekend trading volume drops 20-25% below weekday levels, creating an environment where smaller orders have outsized price impact.
Spoofing
Spoofing (or large orders that vanish before execution) manufactures artificial support or resistance. Whales place large-scale buy orders below market price to create the illusion of demand, attracting retail buyers.
Once price rises, they cancel orders and sell at elevated prices, leaving latecomers trapped. Although illegal in traditional regulated markets, these spoofing patterns remain common on crypto exchanges, where detection systems are still evolving and enforcement is uneven.
Catalyst-driven Distortions
Catalyst-driven distortions amplify trap risk. Token listings, unlocks, and major announcements can overwhelm shallow market depth, especially in lower-cap altcoins. These events produce sharp “breaks” that often reverse when order flow normalizes.
How to Avoid Bull and Bear Market Traps
Avoiding crypto’s bull or bear traps comes down to one thing: wait for confirmation instead of trading on hope. Here’s the framework:
Confirmation Rules
- Wait for higher-timeframe confirmation: Price charts use candlesticks showing movement over time periods (one hour, four hours, one day). Each candle has a body (open/close prices) and thin “wicks” (temporary highs/lows that didn’t hold). Require a four-hour or daily candle to close beyond the key level before sizing up—brief spikes that create long wicks frequently reverse.
- Demand volume validation: Genuine breakouts show above-average volume on the initial move and constructive volume during retests. Weak participation signals trap risk.
- Check for divergences: When price makes new highs/lows but volume indicators (OBV), momentum oscillators (RSI, MACD), or on-chain metrics fail to confirm, suspect a trap.
- Use multiple timeframe analysis: False breakouts rarely persist across timeframes. Confirm that 1-hour, 4-hour, and daily charts align before committing capital.
Watch Market Conditions
- Monitor derivatives positioning: Extreme funding rates (periodic fees traders pay on leveraged positions—highly positive = too many longs, deeply negative = too many shorts) plus rising open interest (total active contracts) near key levels signal overcrowding and trap risk.
- Respect liquidation cascades: After violent wicks and mass liquidations, wait for price to stabilize before entering.
- Avoid thin market windows: Exercise extra caution during weekends, holidays, and off-hours.
- Watch order book depth: Sudden appearance or disappearance of large orders, especially in low-liquidity altcoins, often signals spoofing or manipulation.
Protect Your Downside
- Identify polarity shifts: Former resistance should act as support after genuine breakouts. If the price immediately falls back through the level, the breakout failed.
- Set clear invalidation points: Define exactly where your thesis is wrong and size positions appropriately so a failed confirmation results in a small, manageable loss rather than a portfolio setback.
Note that these practices don’t guarantee trap avoidance since crypto markets remain unpredictable, but they substantially improve odds by filtering out low-probability setups and forcing you to wait for genuine conviction signals before risking capital.
Methods and Tools to Prevent Losses
Even skilled traders occasionally misread signals or get caught in fast-moving traps. That’s why the single most important defensive tool in your arsenal is the stop-loss: an automatic exit that cuts your downside when a trade goes wrong.
What is Stop-Loss?
A stop-loss is an order that automatically closes a position when an asset’s price reaches a predetermined level. In traditional markets, stop-loss orders are useful tools for limiting losses without constantly monitoring positions.
But crypto’s 24/7 market, extreme volatility, and thin weekend liquidity make traditional stop-loss strategies unreliable.
There are a few crypto-specific problems:
- News breaks while you sleep.
- Large traders intentionally push asset prices through common stop levels (just below round numbers like $90K, $100K) to trigger cascades, then buy back cheaper.
- With less volume on weekends, your stop can trigger on a brief wick that immediately reverses.
- Your “guaranteed exit” isn’t guaranteed. During extreme volatility, some exchanges freeze or fail to execute stops.
- Low-liquidity tokens can gap far beyond your stop price during cascades, filling you at terrible levels.
How To Prevent Crypto Bull or Bear Trap Losses
- Support/Resistance Stops: Place your stop just below a price level where buyers have historically stepped in (support) or just above where sellers have historically pushed back (resistance).
- Volatility-Based Stops (ATR): Crypto can swing 5-10% in a single day without changing the overall trend. If you place your stop-loss order too close to your entry price (say, just 2-3% away), normal price fluctuations will kick you out of the trade before the real move happens. That’s the problem with percentage-based stops in crypto: they don’t account for how wild the swings actually are.
The ATR (Average True Range) indicator solves this by measuring how much an asset typically moves in a day. For example, if Bitcoin’s ATR shows $2,000, that means it normally swings about $2K up or down in 24 hours. Some traders place stops at 2x-3x that distance, so ~$4,000-$6,000 away from entry. This gives the trade breathing room to handle normal volatility while still protecting you from real reversals.
Risk Capital Rule
Many experienced traders limit loss per trade to 1-2% of total capital, though individual tolerance varies. This ensures no single trade or trap can seriously damage your portfolio.
These methods represent tools in a risk management toolkit, not guarantees of protection. Each trader must determine which approaches align with their strategy, experience level, and risk tolerance through careful testing and evaluation.
Crypto Trading Tools and Alerts
Crypto markets never sleep, but you do. You can’t watch charts 24/7, so alerts are your automated eyes. Here’s the tool stack that actually works for crypto traders, from simplest to most advanced:
1. Exchange-Native Alerts
Most crypto traders begin here because it’s integrated with their actual trading. Binance, Bybit, OKX, and KuCoin all have built-in alert systems in their mobile apps.
Set price alerts for key levels (example: $87,000 support, $94,000 resistance) and funding rate alerts when they hit extremes. These are instant, and don’t require third-party tools, but come with custody risks, which we will explore later in the article.
Ledger Wallet offers price alerts directly within the app while your crypto stays secured on your signer. You get notifications when Bitcoin, Ethereum, or any tracked asset hits your target prices—without leaving funds exposed on exchanges. This is particularly valuable for long-term holders who want to monitor positions without keeping assets in hot wallets.
2. TradingView
TradingView dominates crypto charting for a reason: it connects to virtually every exchange and offers 50+ alert types.
Set alerts for volume spikes, RSI divergences, or when price touches your trendlines. The free tier covers most needs. Over 65% of retail traders use some form of automation, and TradingView is the hub.
3. Derivatives Aggregators
Coinglass and CoinAnk consolidate liquidation data, funding rates, and open interest across all major exchanges.
Are longs overcrowded everywhere? Is a liquidation cascade building? These tools are essential for spotting traps before they spring, since positioning on one exchange might not tell the full story.
4. Mobile-First Crypto Apps
For on-the-go traders, apps like TabTrader and 3Commas combine exchange APIs with advanced alerting. They’ll ping you when volume spikes on your watchlist or when liquidation heatmaps show concentration at a key level. These are particularly useful for DeFi traders who operate across multiple chains.
For multi-asset tracking, Ledger Wallet’s portfolio view consolidates holdings across 15,000+ coins and tokens with real-time price tracking, eliminating the need to check multiple wallets or exchanges. You can set alerts on your entire portfolio while maintaining secure digital ownership through your signer.
5. On-Chain & Whale Tracking
Crypto whale tracking means tracking large transactions in real-time, revealing accumulation or distribution before it hits exchanges—often the first signal a trap is forming.
6. Wallet Watch & Onchain Activity
Some crypto tools let you monitor specific wallets (whales, smart money, known manipulators) for transaction activity. When these addresses move funds to exchanges or interact with lending protocols, it can signal incoming volatility or trap setups before the price reacts.
Ledger Wallet also alerts you to any transaction activity on your own addresses, providing an additional security layer. If any unexpected movement occurs on wallets you’re monitoring, you’ll receive immediate notifications—useful for detecting unauthorized access attempts or confirming legitimate transfers.
AI Bots and Strategy
Automated trading bots promise hands-free execution and emotion-free discipline. The marketing sounds perfect: “Set it and forget it,” or “AI-powered profits while you sleep.” For crypto newcomers juggling day jobs and 24/7 markets, this is incredibly appealing.
But the gap between promise and reality is where most trading portfolios get destroyed.
AI Bot Risks
1. Security Risks (Your Money Disappears)
Security is the biggest danger. In November 2025 alone, Binance documented 12 hacked accounts losing over 18,000 USDT from authorizing third-party bots. Attackers embed backdoors in legitimate-looking tools – even “verified” bots with positive reviews can hide malware in opaque codebases.
2. Performance Risks (Bots Amplify Losses)
Performance failures compound the risk. Bots lack the pattern recognition needed to distinguish real breakouts from traps. During November 2025’s $1.1 billion liquidation cascade, algorithmic systems mechanically executed stops without recognizing the trap-and-reversal pattern, amplifying losses rather than protecting capital.
3. Financial Risks (Hidden Costs Add Up)
Beyond security breaches, bots will cost you:
- Subscription fees: ~$30-100/month for “premium” bots
- Exchange fees: High-frequency bots rack up trading fees that eat profits
- Slippage: Bots execute market orders during volatile periods, filling them at terrible prices
- Opportunity cost: Time spent configuring and monitoring bots could be spent learning manual trading
For navigating bull and bear traps specifically, bots are more of a liability than asset because they lack the pattern recognition needed to distinguish real breakouts from traps.
Using a Signer to Secure Your Funds
Trading skill gets you into winning positions, but security keeps you there.
Even disciplined manual traders face a fundamental problem: leaving all your assets on an exchange concentrates multiple risks: counterparty failure if the exchange collapses, API or bot abuse that can drain accounts, and custodial control where you don’t actually own the crypto, just an IOU.
If you want full control over your digital assets (and financial destiny), you need to have complete control over your private keys and secure them properly; there’s no other way to practice secure digital ownership.
Secure Digital Ownership with Ledger Signers
Digital ownership with a Ledger signer physically isolates your private keys offline inside a Secure Element chip, the same tamper-resistant technology used in passports and payment cards.
With a Ledger signer, your private keys never leave the device even when connected to your computer; every transaction requires physical confirmation on the signer’s secure screen, so malware or rogue bots can’t move your funds.
What’s even better is that in addition to a screen built solely around securing digital assets, you’ll have Clear Signing integrations across various apps and dApps across web3 – meaning you’ll know exactly what transaction you’d be signing in human-readable format using the screen for at-a-glance verification.
With Ledger, active traders don’t need to choose between security and accessibility, so keeping long-term holdings on your Ledger Wallet™ portfolio while maintaining only limited funds on exchanges for active positions protects you in your trading journey.
All you’ll need to do is periodically sweep profits back to your signer and never grant automated tools withdrawal permissions to your main holdings. If a bot, exchange, or laptop is compromised, the damage is limited to what you chose to leave on the exchange (or other software wallets you may use), while your core crypto assets remain anchored behind the signer.
Conclusion: From Reactive to Strategic Trading
The crypto market’s unique structure creates an environment where bull and bear traps proliferate with alarming frequency. Recent 2025–2026 data confirms this reality: $180 million liquidations daily during volatile periods, funding rates remain positive 92% of the time signaling persistent long-side crowding, and single-day liquidation events can exceed billions as traps spring shut on overleveraged positions.
Yet these challenging conditions also present opportunities for disciplined traders who prioritize confirmation over conviction, volume validation over price action alone, and derivatives positioning analysis over blind technical patterns.
The tools exist, but only systematic application with proper risk management transforms knowledge into consistent results.
And proper risk management starts with secure digital ownership: learning to identify traps protects your trading capital, but proper self-custody with a Ledger signer protects everything else.
